Fed Vice Chair Jefferson Flags AI Boom as 10Y Yield Hits 5.15%
Fed Vice Chair Philip Jefferson warns trillion-dollar AI data center spending fuels inflation as 10-year Treasury yields hit 5.15% ahead of December FOMC.
Executive Macroeconomic & Policy Briefing
Federal Reserve Vice Chair Philip Jefferson signaled on November 14, 2026, that trillion-dollar capital outlays for artificial intelligence data centers are straining industrial resources and sustaining inflation above the 2.0% objective. Coupled with October wholesale PPI hitting a four-year high of 6.5% year-over-year, fixed-income markets repriced sharply for a December FOMC rate hike, pushing the benchmark 10-year U.S. Treasury yield to 5.15% and the 2-year note to 4.88%.
- Vice Chair Jefferson identified hyperscale AI infrastructure spending as an active demand-side inflation driver rather than purely a disinflationary productivity shock.
- U.S. 10-year Treasury par yields reached 5.15% while 2-year yields surged 42 bps since November 5 to 4.88%, holding the 2s10s spread at +27 bps.
- October 2026 Bureau of Labor Statistics PPI surged 6.5% year-over-year with a 0.5% monthly Core PPI jump, reinforcing hawkish FOMC rate expectations.
- A +25 bps Fed Funds hike from the 3.75%–4.00% target range increases annual debt service by $2,500 per $1,000,000 of floating-rate corporate debt.
Fixed-Income Repricing Alert Ahead of December 9 FOMC
AI Capital Expenditures Collide With Sticky Wholesale Inflation
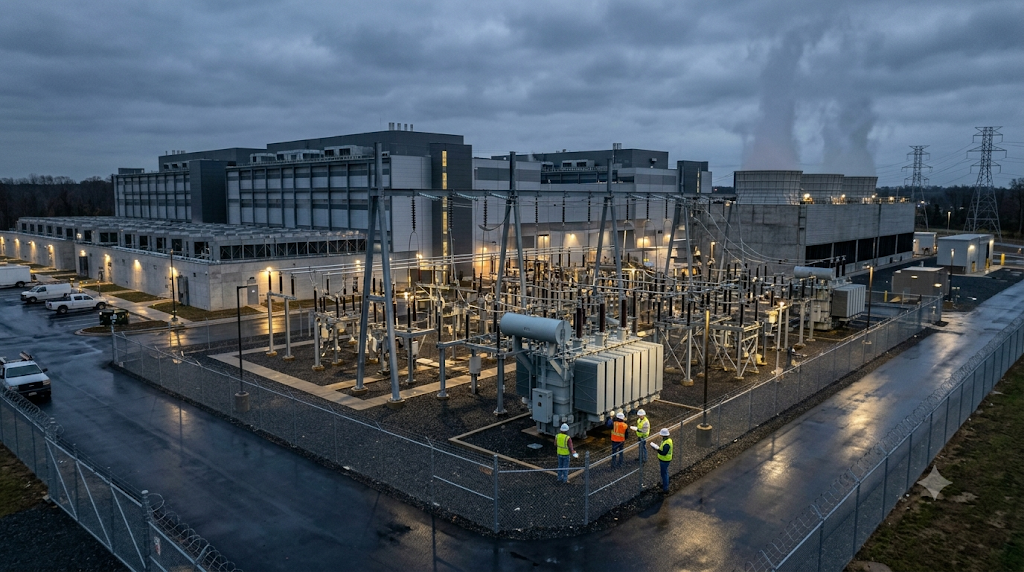
Federal Reserve Vice Chair Philip Jefferson warned on November 14, 2026, that trillion-dollar capital expenditures in artificial intelligence data centers are straining industrial capacity and keeping inflation above the central bank's 2.0% mandate. Speaking ahead of the December 9 FOMC policy meeting, Jefferson emphasized that near-term demand for electrical grid equipment, semiconductors, and skilled construction labor outweighs longer-term productivity gains.
Fixed-income markets responded immediately to the hawkish policy signal and hot producer price data. Benchmark 10-year U.S. Treasury yields climbed to 5.15% while the 2-year note jumped 42 basis points over eight trading sessions to 4.88%, compressing the 2s10s spread to +27 bps ahead of the December 9 FOMC decision.
Live U.S. Macroeconomic & Treasury Benchmarks (November 15, 2026)
“The massive scale of business investment flowing into artificial intelligence infrastructure is currently placing tangible pressure on physical supply chains and resource utilization, requiring the Committee to keep inflation readings at the center of our policy calculus.”
Monetary Transmission Mechanism and Bear Flattening Dynamics
Institutional consensus previously assumed artificial intelligence adoption would act primarily as a supply-side disinflationary tailwind. Vice Chair Jefferson's remarks dismantle that assumption for the near-term horizon by framing hyperscale data center construction as an acute aggregate demand shock competing for finite power generation and industrial inputs.
Data released by the Bureau of Labor Statistics underscores this bottleneck. October 2026 Producer Price Index final demand accelerated to a four-year high of 6.5% year-over-year, with Core PPI rising 0.5% month-over-month. Upstream wholesale price pressures typically feed into core consumer goods and services with a one-to-two quarter lag, complicating the Federal Reserve's path back to price stability alongside 3.4% Headline CPI and 3.3% Core PCE.
- Front-End Rate Repricing: Because the 2-year Treasury yield (4.88%) tracks expected FOMC policy moves over the next 24 months, its 42 bps surge outpaced the 10-year note (5.15%), reinforcing a bear-flattening curve posture at a +27 bps 2s10s spread.
- External Capital Flow Cushion: While foreign official and private investors hold $9.2481 trillion in U.S. Treasuries and generated $83.7 billion in total net cross-border TIC inflows ($40.6 billion in long-term securities), domestic inflation momentum currently dominates yield pricing, all else equal (ceteris paribus).
- Credit Market Spillover: Higher risk-free Treasury benchmarks directly elevate commercial prime rates, warehouse funding lines, and residential mortgage pricing. Borrowers evaluating financing structures can benchmark current institutional spreads via our bank interest rates comparison or estimate payment sensitivity using a mortgage payment calculator.
U.S. Policy Benchmarks, Yield Curve & Inflation Matrix
| Macroeconomic Benchmark | Current Reading (Nov 2026) | Prior Reference Level | Balance Sheet & Market Transmission |
|---|---|---|---|
| Federal Funds Target Range | 3.75%–4.00% | 3.50%–3.75% (Prior FOMC) | Anchors overnight bank reserves, SOFR, and commercial Prime lending benchmarks |
| U.S. 10-Year Treasury Yield | 5.15% | 5.01% (Early Nov Baseline) | Sets floor for agency MBS coupons, fixed commercial mortgages, and corporate bonds |
| U.S. 2-Year Treasury Note | 4.88% | 4.46% (Nov 5, 2026) | Reflects aggressive market pricing for a +25 bps December 9 FOMC rate increase |
| U.S. 1-Year Treasury Bill | 4.45% | 4.38% (Prior Auction) | Governs short-duration money market funds and Treasury bill liquidity yields |
| 2s10s Treasury Curve Spread | +27 bps | +27 bps (Bear Flattening) | Signals restrictive near-term policy expectations relative to long-run neutral rates |
| BLS Headline PPI / Core PPI | 6.5% YoY / +0.5% MoM | 6.2% YoY / +0.3% MoM | Confirms upstream pipeline inflation from industrial, energy, and AI capex demand |
| FHFA Conforming Loan Limit | $832,750 | $806,500 (2025 Limit) | Establishes maximum eligible balance for standard agency-backed residential mortgages |
Source: Federal Reserve Board, U.S. Department of the Treasury (Nov 13–14, 2026), Bureau of Labor Statistics, and FHFA.

Macro Transmission Modeling and Balance Sheet Impact
When front-end Treasury yields reprice rapidly ahead of an FOMC meeting, borrowers holding floating-rate credit lines experience immediate cash flow compression without the grace period afforded by fixed-rate amortizing notes. Below is an exact balance-sheet stress test modeling FOMC rate pass-through on commercial working capital.
1. Base Debt Service Facility Modeling
Consider a mid-market industrial supplier carrying a $1,000,000 floating-rate revolving working capital facility indexed to overnight benchmarks at an initial all-in borrowing rate of 6.25% (interest-only monthly reset). Under baseline conditions, annual interest debt service equals $62,500.00, requiring $5,208.33 in monthly cash outlay. Against $100,000 in annual Net Operating Income (NOI), the borrower operates at a baseline Debt Service Coverage Ratio (DSCR) of 1.60x ($100,000 / $62,500).
2. Rate Pass-Through and Stress Sensitivity
If the FOMC executes a +25 bps policy hike on December 9, direct pass-through resets the facility rate to 6.50%. Annual debt service rises to $65,000.00 ($5,416.67/month), creating an immediate cash flow dislocation of +$2,500.00 per year (+$208.33/month) and compressing DSCR from 1.60x to 1.54x ($100,000 / $65,000). Under an additional cumulative stress scenario of +50 bps above baseline (pushing the borrowing rate to 6.75%), annual interest jumps to $67,500.00 ($5,625.00/month)—a +$5,000.00/year (+$416.67/month) cash drain that compresses DSCR further to 1.48x.
3. Leverage Thresholds and Strategic Recommendations
- Audit Covenant Headroom & Hidden Transaction Fees: Commercial loan agreements frequently trigger technical default or pricing step-ups if DSCR falls below 1.25x–1.35x. Before refinancing into fixed-rate term debt, audit credit agreements for yield-maintenance prepayment penalties, appraisal fees ($2,500–$5,000), and legal closing charges, while noting that consumer adjustable-rate residential mortgages remain protected against prepayment penalties under CFPB Regulation Z (12 CFR 1026.43(g)).
- Accelerate Principal Curtailment & Build Liquidity Buffers: Maintaining a dedicated cash reserve equal to 6 months of stressed debt service ($33,750 at 6.75%) insulates operations against rate shocks. For amortizing facilities, making one extra monthly payment per year cuts total interest expense substantially—simulate exact principal curtailment timelines using our advanced amortization loan calculator or compare short-term reserve yields via a savings interest calculator.
Balance Sheet Positioning in a 5.15% Treasury Yield Environment
Strategic Advantages for Cash-Rich Entities
- ✓Elevated front-end yields (4.45% on 1Y Bills and 4.88% on 2Y Notes) allow corporate treasuries and savers to lock in real positive returns above 3.4% Headline CPI.
- ✓Stronger U.S. yield differentials support U.S. Dollar purchasing power for domestic importers purchasing overseas equipment.
Financial Risks for Leveraged Borrowers
- ✕Floating-rate commercial borrowers face immediate +25 bps to +50 bps interest expense resets with zero lag once the FOMC adjusts the 3.75%–4.00% target range.
- ✕A 5.15% 10-year Treasury benchmark keeps 30-year mortgage and long-term corporate bond issuance costs elevated, compressing project IRR.
Featured Financial Utility: Bank Interest Rates Comparison
Compare live mortgage rates, Treasury-linked CD yields, and high-yield savings APY across major U.S. financial institutions.
Monetary Policy & Treasury Yield Outlook FAQs
Why does Federal Reserve Vice Chair Philip Jefferson view AI data center spending as inflationary?
While artificial intelligence may boost labor productivity over the long run, the immediate construction of hyperscale data centers requires trillions of dollars in electrical transformers, grid capacity, semiconductors, and specialized construction labor. Vice Chair Jefferson noted on November 14, 2026, that this concentrated capital expenditure strains physical supply chains today, pushing wholesale PPI inflation to 6.5% year-over-year and keeping upward pressure on prices.
How does a 5.15% 10-year Treasury yield affect commercial and residential borrowing costs?
The 10-year U.S. Treasury yield serves as the primary pricing anchor for fixed-rate corporate bonds, commercial real estate loans, and agency mortgage-backed securities (MBS). When the 10-year yield rises to 5.15% alongside a 4.88% 2-year note, lenders widen credit spreads to protect margins, raising borrowing rates on new mortgages above the $832,750 FHFA conforming baseline and increasing refinancing costs across credit markets.
What steps can borrowers take right now to protect cash flow ahead of the December 9 FOMC meeting?
Borrowers with unhedged floating-rate debt should stress-test their Debt Service Coverage Ratio (DSCR) for an immediate +25 bps to +50 bps rate hike, evaluate interest rate caps or fixed-rate term conversions before December 9, and hold at least six months of stressed debt service in liquid high-yield accounts earning 4.25%+ APY to offset higher interest outflows.