AAA U.S. Regular Gas Plunges 18 Cents to $3.72/Gal
AAA U.S. regular gas drops 18 cents to $3.72 per gallon—a 50-cent three-week slide—as lower crude oil prices cut household and freight fuel expenses.
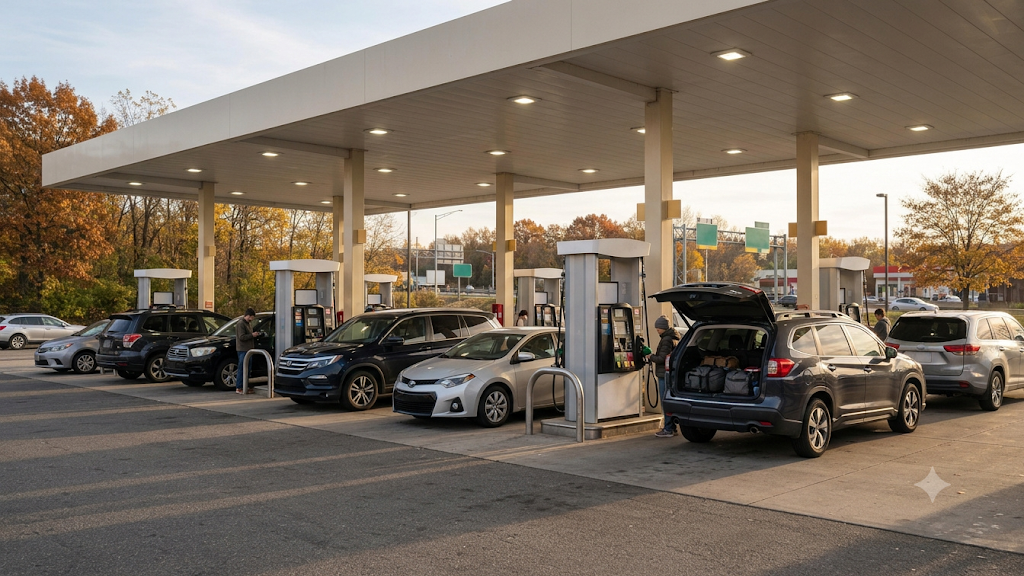
Executive Energy & Petroleum Briefing
The AAA national average for regular unleaded gasoline plunged 18 cents over the past week to $3.72 per gallon as of November 19, 2026. Cumulative pump relief has reached 50 cents per gallon over three weeks—the steepest three-week drop since 2008—driven by softer NYMEX WTI crude futures at Cushing, Oklahoma, post-maintenance refinery runs, and elevated seasonal gasoline inventories ahead of peak Thanksgiving highway travel.
- The AAA national average regular gasoline price dropped 18 cents week-over-week to $3.72 per gallon, reaching its lowest level since March 16, 2026.
- Retail pump prices have fallen 50 cents per gallon over the last 21 days, representing the sharpest three-week retail decline since 2008.
- Lower wholesale RBOB gasoline futures and retreating WTI crude oil benchmarks are compressing retail rack-to-pump spreads ahead of Thanksgiving travel by 73 million motorists.
- A 50-cent per gallon decline saves an average U.S. household driving 1,200 miles monthly roughly $288 annually in direct fuel outlays.
Market Context & Pre-Thanksgiving Pump Relief
The AAA national average for regular gasoline dropped 18 cents over the past week to $3.72 per gallon as of November 19, 2026. Over the past three weeks, the national average retail price has fallen by 50 cents per gallon, marking the sharpest three-week decline since 2008 and the lowest reading since March 16, 2026.
This rapid downward repricing arrives just days before peak holiday travel, when an estimated 73 million Americans are projected to travel by automobile for the upcoming Thanksgiving holiday window. Retreating crude oil futures on NYMEX, strong Gulf Coast refinery utilization following autumn turnarounds, and softer domestic motor fuel demand have combined to deliver immediate cash flow relief to both household budgets and commercial freight operators.
U.S. Retail & Wholesale Petroleum Snapshot
Crude Oil Supply Dynamics and Refining Margin Compression
Downward momentum at retail fuel dispensers reflects a synchronized unwind across upstream crude benchmarks and downstream refined product markets. When West Texas Intermediate (WTI) crude futures at the Cushing, Oklahoma delivery hub and international Brent blend contracts retreat, wholesale RBOB gasoline spot prices adjust within 24 to 72 hours, forcing retail station operators to pass savings through to motorists.
According to U.S. Energy Information Administration (EIA) Weekly Petroleum Status Report dynamics, U.S. refiners exiting scheduled fall maintenance have ramped up crude distillation runs while switching fully to lower-cost winter-grade gasoline blends. Winter-grade fuel incorporates higher Reid Vapor Pressure (RVP) butane components that are substantially cheaper to blend than summer-spec reformulated gasoline, trimming wholesale rack costs by $0.15 to $0.25 per gallon.
- Refinery Utilization Recovery: PADD 3 (Gulf Coast) and PADD 2 (Midwest) refining complexes have boosted motor gasoline output, rebuilding regional commercial stockpiles ahead of late-November demand.
- Crack Spread Normalization: Gasoline crack spreads—the gross margin refiners earn converting crude oil into motor fuel—have narrowed sharply, eliminating upstream bottleneck premiums.
- Macroeconomic CPI Pass-Through: Because motor fuel carries a direct weight in Headline Consumer Price Index (CPI) baskets and freight diesel surcharges, sustained pump relief eases short-term inflation pressure while households evaluate broader financing options via bank interest rates comparison and reallocate freed cash flow using a savings interest calculator.
U.S. Petroleum Supply Chain & Retail Fuel Transmission Matrix
| Supply Chain Tier | Primary Benchmark / Metric | Observed Trend (Nov 2026) | Operational & Cost Driver |
|---|---|---|---|
| Retail Pump Benchmark | AAA National Average Regular | $3.72/gallon (-$0.18/wk) | 50-cent 3-week drop; lowest since March 16, 2026 |
| Upstream U.S. Crude | NYMEX WTI Futures (Cushing, OK) | Downward Repricing | Ample North American supply and softer global demand |
| International Crude | ICE Brent Blend Benchmark | Downward Repricing | Reduced geopolitical risk premium and non-OPEC output |
| Refining & Blending | EIA Weekly Petroleum Status | Winter-Grade Transition | Post-turnaround run rate expansion and cheaper butane blending |
| Consumer Demand | Thanksgiving Highway Volume | 73 Million Motorists | Seasonal holiday road travel cushioned by lower per-gallon outlay |
Source: AAA Fuel Prices (November 19, 2026) and U.S. Energy Information Administration (EIA) Petroleum Supply Frameworks.
Supply Chain & Regional Basis Risk Advisory

Economic Impact: Falling Retail Gasoline Prices
Household & Logistics Advantages
- ✓Immediate discretionary cash flow expansion for 73 million Thanksgiving highway travelers and daily commuters
- ✓Lower diesel and fleet fuel surcharges across domestic trucking, grocery, and retail distribution networks
- ✓Downward pressure on Headline CPI energy components, easing near-term household inflation expectations
Market & Macro Risks to Monitor
- ✕Potential rebound in pump prices if unscheduled refinery outages or winter storms disrupt Gulf Coast operations
- ✕Upstream margin compression for domestic shale producers if WTI crude remains depressed below breakeven thresholds
- ✕Persistent regional price spikes in isolated West Coast and Rocky Mountain fuel markets
Energy Cost Modeling and Household Cash Flow Impact
To quantify the real-dollar impact of the 50-cent per gallon three-week retail gasoline plunge—from $4.22 per gallon three weeks ago down to $3.72 per gallon today—we model both a standard U.S. commuter household and a regional commercial delivery fleet.
1. Baseline Fuel Expenditure & Fleet Operating Costs
A typical U.S. household driving 1,200 miles per month in a vehicle averaging 25 miles per gallon (MPG) consumes exactly 48 gallons of gasoline per month (576 gallons annually). At the prior benchmark of $4.22 per gallon, monthly fuel expenditure stood at $202.56 ($2,430.72 per year). At today's AAA national average of $3.72 per gallon, monthly outlay drops to $178.56 ($2,142.72 per year), generating $24.00 per month or $288.00 in annualized savings. For a regional commercial van fleet consuming 1,500 gallons per month (18,000 gallons annually), the $0.50 per gallon drop reduces monthly fuel expense from $6,330.00 to $5,580.00, freeing $750.00 per month ($9,000.00 annually) in operating cash flow.
2. Price Volatility & Pass-Through Sensitivity
Fuel budgets remain highly sensitive to sudden crude oil reversals or winter refinery disruptions:
- +$0.25/gallon rebound (to $3.97/gal): Adds $12.00/month ($144.00/year) to the 48-gallon household budget and $375.00/month ($4,500.00/year) to the 1,500-gallon commercial fleet.
- +$0.50/gallon rebound (back to $4.22/gal): Restores $24.00/month ($288.00/year) in household fuel costs and $750.00/month ($9,000.00/year) in fleet overhead.
- +$0.75/gallon supply shock (to $4.47/gal): Increases annual household fuel spending by $432.00 and commercial fleet expenses by $13,500.00.
3. Margin Protection & Strategic Recommendations
- Redirect Fuel Savings Into High-Yield Vehicles: Rather than absorbing the $24.00 to $750.00 monthly windfall into discretionary spending, households can project long-term wealth accumulation with a compound interest calculator or apply savings toward principal reduction when evaluating vehicle upgrades via an auto loan monthly payment calculator.
- Audit Commercial Fuel Surcharge Schedules: Shippers and logistics managers should verify that carrier fuel surcharge tables update weekly against EIA retail indices so lower pump prices immediately reduce freight invoices.
- Leverage Fleet Cards and Tiered Rebates: Utilizing commercial fuel cards or retail loyalty programs offering $0.05 to $0.15 per gallon off rack or pump prices locks in an additional $86.40 to $2,700.00 in annual savings.
Featured Financial Utility: bank interest rates comparison
Compare mortgage rates, CD yields and high-yield savings APY across US banks
Energy Markets & Fuel Pricing FAQs
Why did AAA U.S. regular gas drop 50 cents per gallon in just three weeks?
The 50-cent three-week decline to $3.72 per gallon—the steepest 21-day drop since 2008—was driven by lower NYMEX WTI crude oil futures, high Gulf Coast refinery utilization following autumn maintenance, and the seasonal switch to cheaper winter-grade gasoline blends.
How quickly do changes in NYMEX WTI crude oil futures affect retail gas station prices?
Changes in WTI crude oil and wholesale RBOB gasoline futures typically transmit to retail gas station signs within 24 to 72 hours for rapid declines at high-volume stations, though full pass-through across independent retailers can take 7 to 14 days depending on local inventory turnover.
How much does a $0.50 per gallon gas price drop save an average U.S. driver?
A driver covering 1,200 miles per month in a 25 MPG vehicle burns 48 gallons monthly (576 gallons annually). A $0.50 per gallon reduction saves exactly $24.00 per month or $288.00 per year in direct fuel expenses.